02 · All-time Analytics 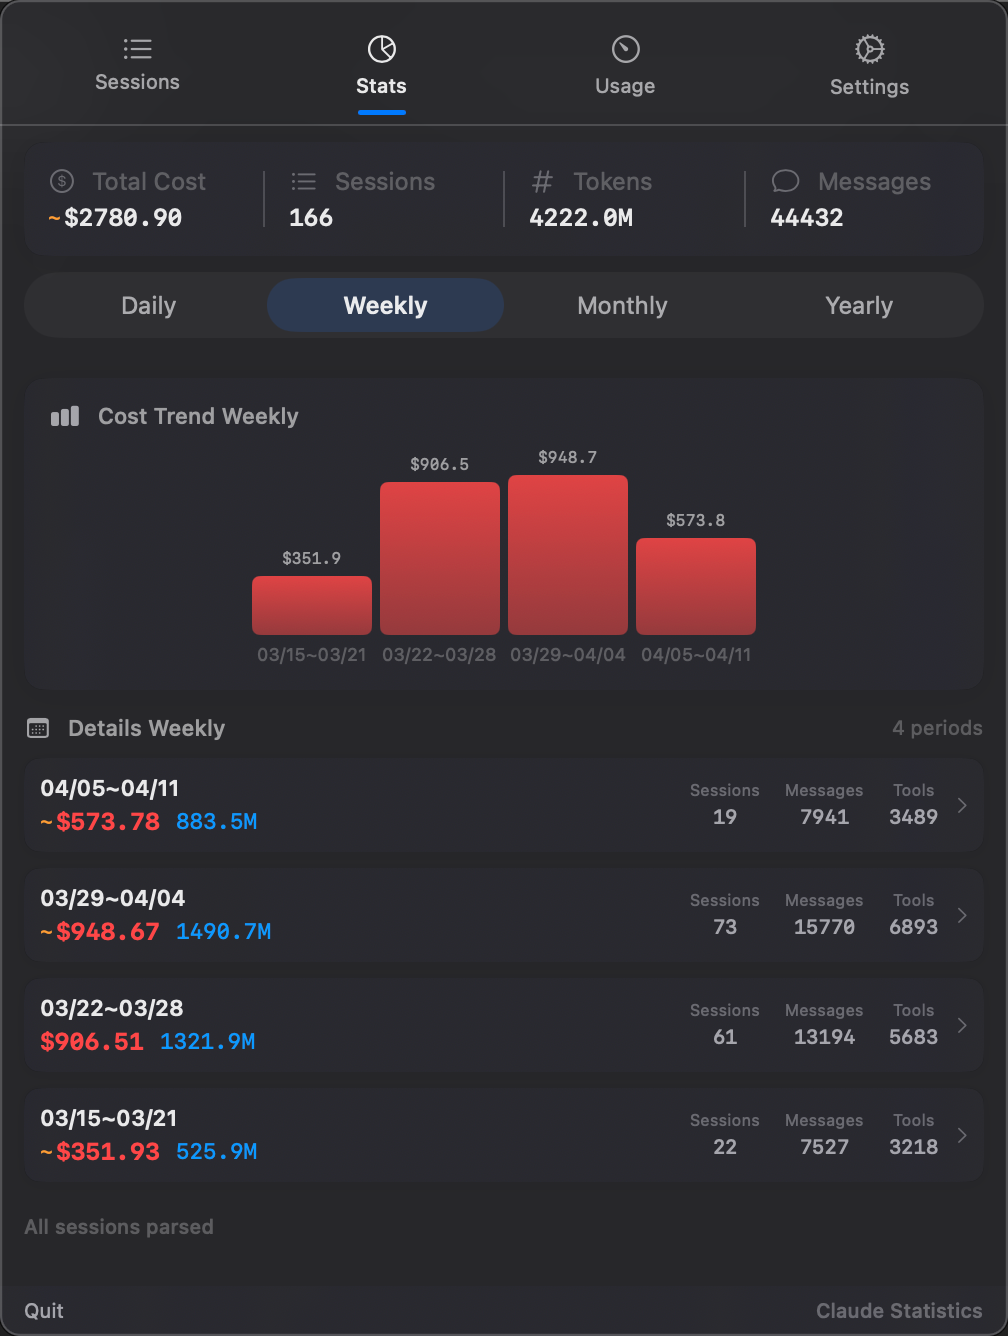
53-week heatmap. Daily rhythm. Real cost signal.
All-time, daily, weekly and monthly views aggregated across Claude Code, Codex CLI and Gemini CLI. Project rankings ordered by cost, dual-axis trend charts, model and cache distribution.
01
Heatmap that reflects real usage
Hot cells are calibrated to your token throughput, not session count, so a five-minute spike doesn't look the same as a deep work day.
02
Period drill-down
Switch between All / Daily / Weekly / Monthly without recomputing. Click any project to expand a dual-axis trend over the same period.
03
Cost-first ranking
Projects are ordered by spend, not just activity. Per-row cost, token total and model split tell you where the budget actually went.
How it works
Cost is computed per-model from a pricing table you can edit. Cache read/write is tracked separately so the totals reflect what your provider actually billed.
- 01 Pricing table A built-in pricing table covers Anthropic, OpenAI and Google models. You can override entries when a model is added or repriced.
- 02 Local aggregation Aggregates roll up by day, week, month and project — recomputed incrementally as new turns land.
- 03 Multi-provider math Token totals are kept per-provider so cross-provider charts stay meaningful even when one CLI changes its accounting.
Where it shines
-
✦
End of week budget check Open the Stats tab on Friday and the heatmap, project ranking and model split tell you whether the week stayed inside plan.
-
✦
Compare two projects honestly Drill into project A and B over the same period; the dual-axis chart shows tokens vs. cost so you can spot which one is using cheaper models.